In this article, we explore what factors you need to take into account when calculating how long it might take for automated guided vehicles to pay for themselves and what further savings they might represent over time, compared to using human-driven vehicles.
If you prefer a quicker, automated approach, you can also plug your company's numbers and needs into our dedicated AGV ROI Calculator.
Note: in this article, we use the term AGV as a catch-all for any type of automated industrial vehicle, including automated forklifts and mobile robots.
The information you need to calculate AGV ROI
In this section, we explain what numbers you need to know in order to accurately calculate the potential ROI AGVs might offer your organization. Then, we’ll slot these into the real calculation.
1. How many manual vehicles are you currently running and how much do they cost?
Most AGV and automated forklift deployments happen on existing, 'brownfield' sites. Therefore, we'll assume your business is currently one of these, and running a number of manual vehicles or transportation tools on-site. If you have different types of vehicles in operation, the most simple approach will be to calculate their average cost.
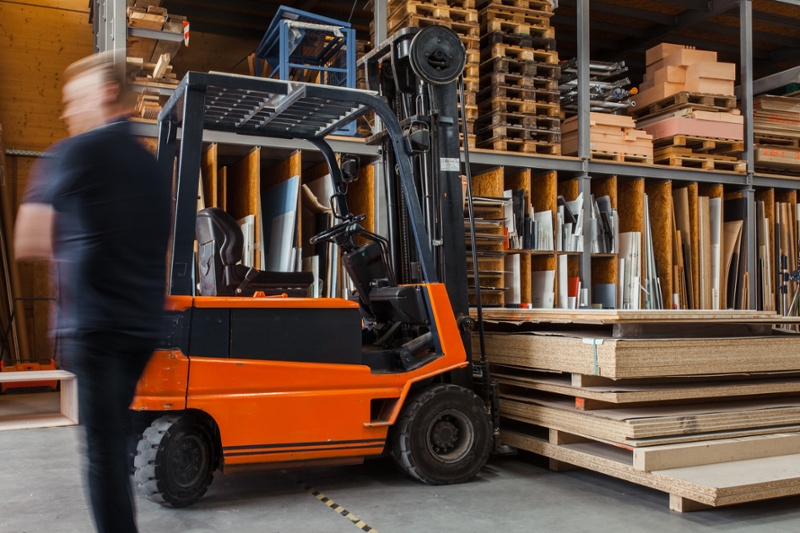
Next, you need to calculate the annual maintenance cost of your existing manual vehicles. A good rule of thumb is 5% of a manual forklift’s cost price per year, although your business may spend more or less than that. This could be a good time to examine your company’s figures from the last three years to find out exactly what vehicle maintenance really costs your business.
To summarize, you need to gather the following information:
- Number of manual vehicles
- Cost per vehicle
- Annual maintenance cost (%)
2. How much are your vehicle-related labor costs?
First, note down the number of (eight-hour) shifts that your vehicle operations staff work per day, and the number of working days per week.
Next, you need to know a driver’s typical salary, as well as any related staff overheads (as a percentage of the driver’s salary). This catch-all ‘overheads’ category will cover any employee-associated costs such as taxes, social payments and bonuses. Don’t forget to account for space in your facility: cafeteria, parking spaces and so on.
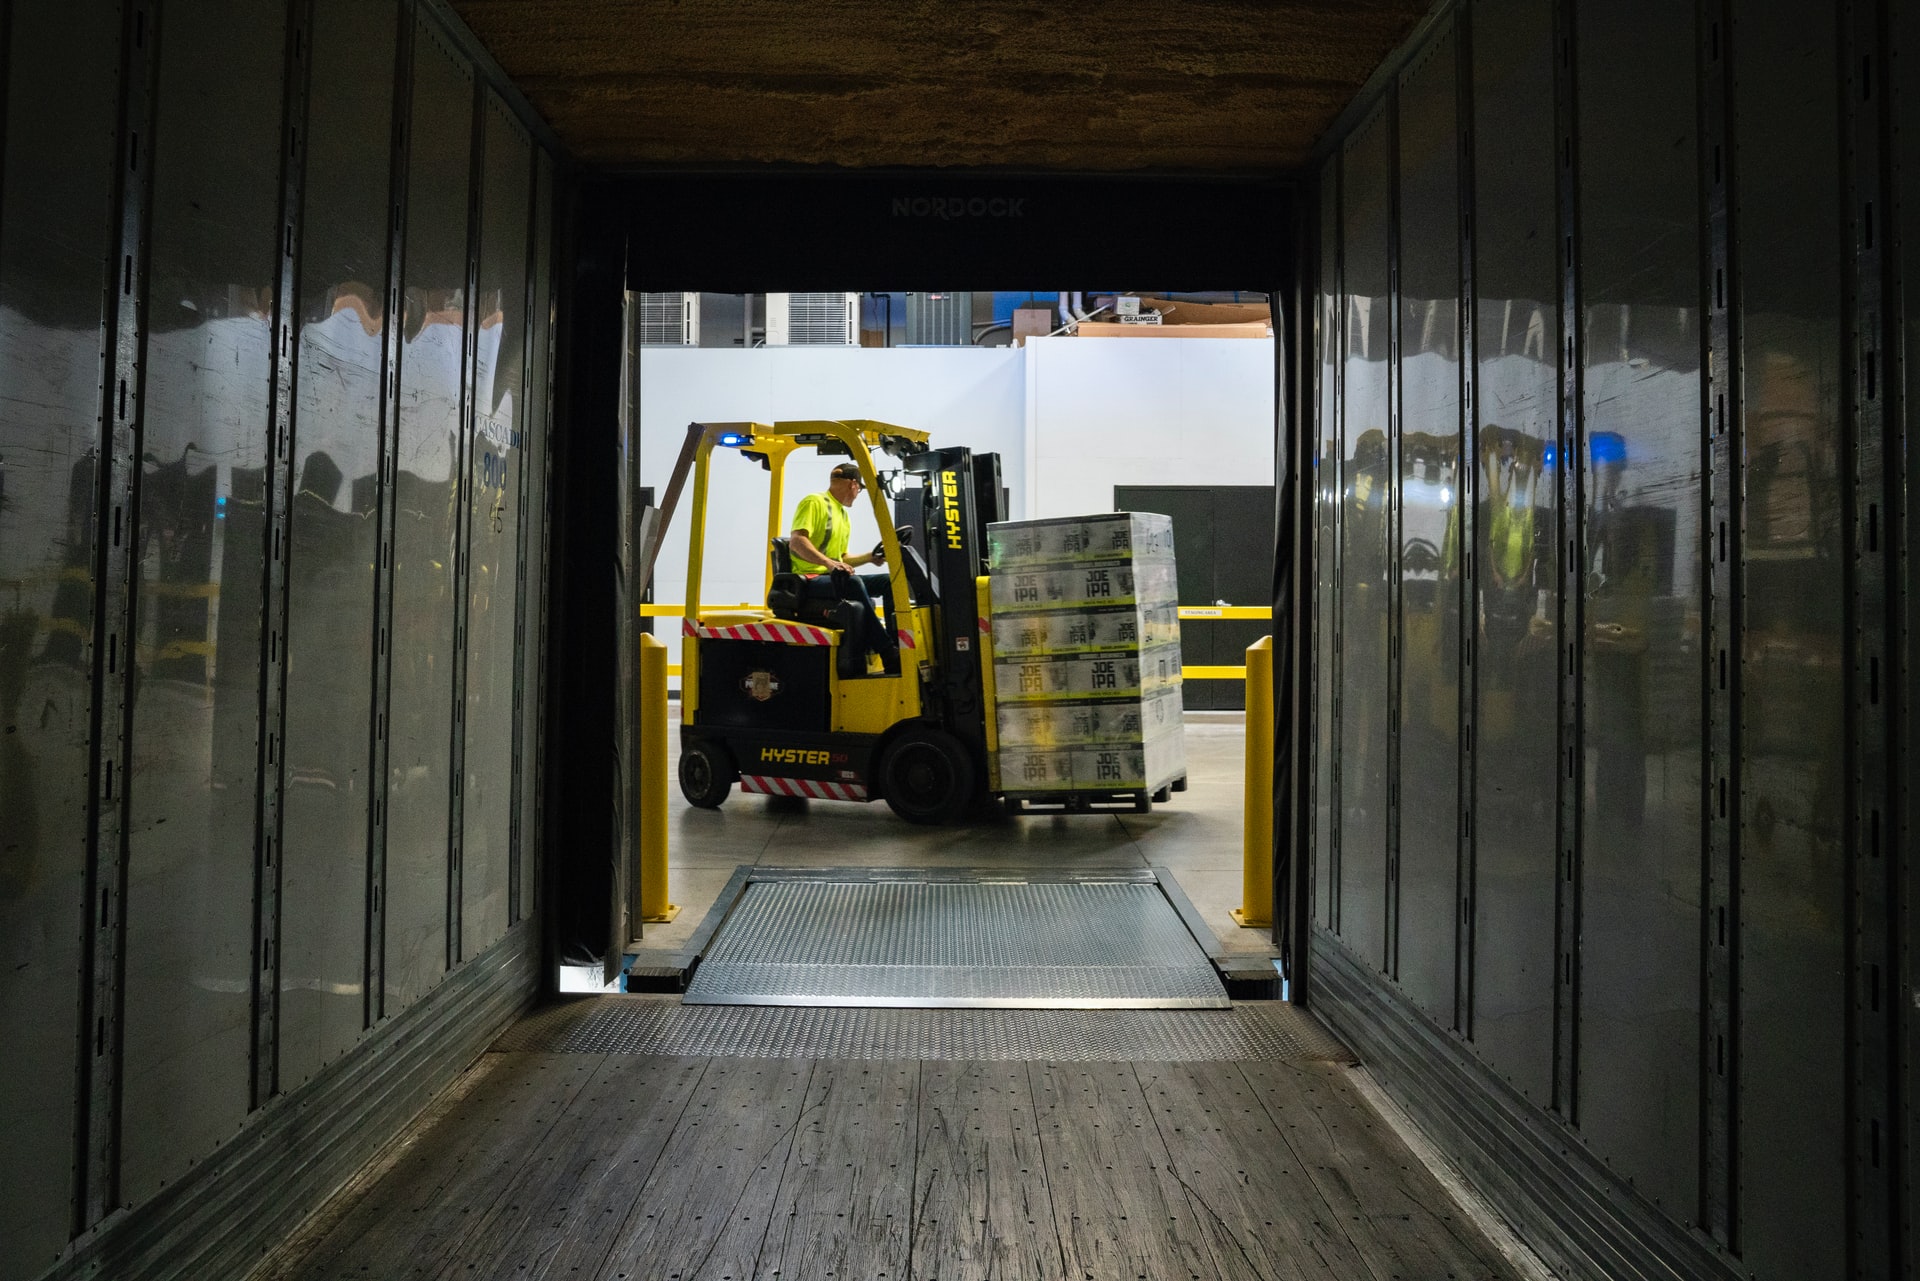
Finally, you need to know the annual cost of any damage caused by your fleet of manual vehicles. This could be the cost of damage to goods, infrastructure or the vehicles themselves. Consider taking the annual average from the past three or five years to ensure accuracy.
To summarize, you need to know:
- Number of shifts per day
- Number of days per week
- Number of drivers (full-time equivalent)
- Annual driver salary
- Annual driver overheads (%)
- Annual damage cost
3. How many AGVs will you need?
AGVs and manual vehicles are not exact equivalents. AGVs typically drive slower than human-driven vehicles; they will never “cut corners” or exceed their programmed speed limit either. And humans can obviously react to changing situations and dangers in a way that AGVs cannot; AGVs can only follow a programmed route, while humans can react in the moment and perform impromptu jobs – no additional programming required!
However, if your business runs multiple shifts per day, you may find the effect of this speed difference gradually disappears.
Generally speaking, the industry-accepted standard is that between 1.3 and 1.5 AGVs will replace one manually-driven vehicle (in this site's ROI Calculator tool we use 1.4 as the default). Take note of the following information:
- Number of AGVs required to replace 1 manual vehicle (1.3-1.5)
- Total number of AGVs required
4. How much do your preferred AGVs cost?
Now, you need to estimate the total cost of the AGVs you are considering. Again, if you are considering different types of vehicles, we recommend taking their average cost.
For example, you may like the idea of installing four automated forklifts costing USD $120,000 each, and one driverless tow tractor costing $60,000. The average price of all these vehicles would therefore be $108,000.
You also need to know the predicted maintenance cost of these automated guided vehicles. The industry standard here is 10% of a vehicle’s price; double that of manual vehicles.
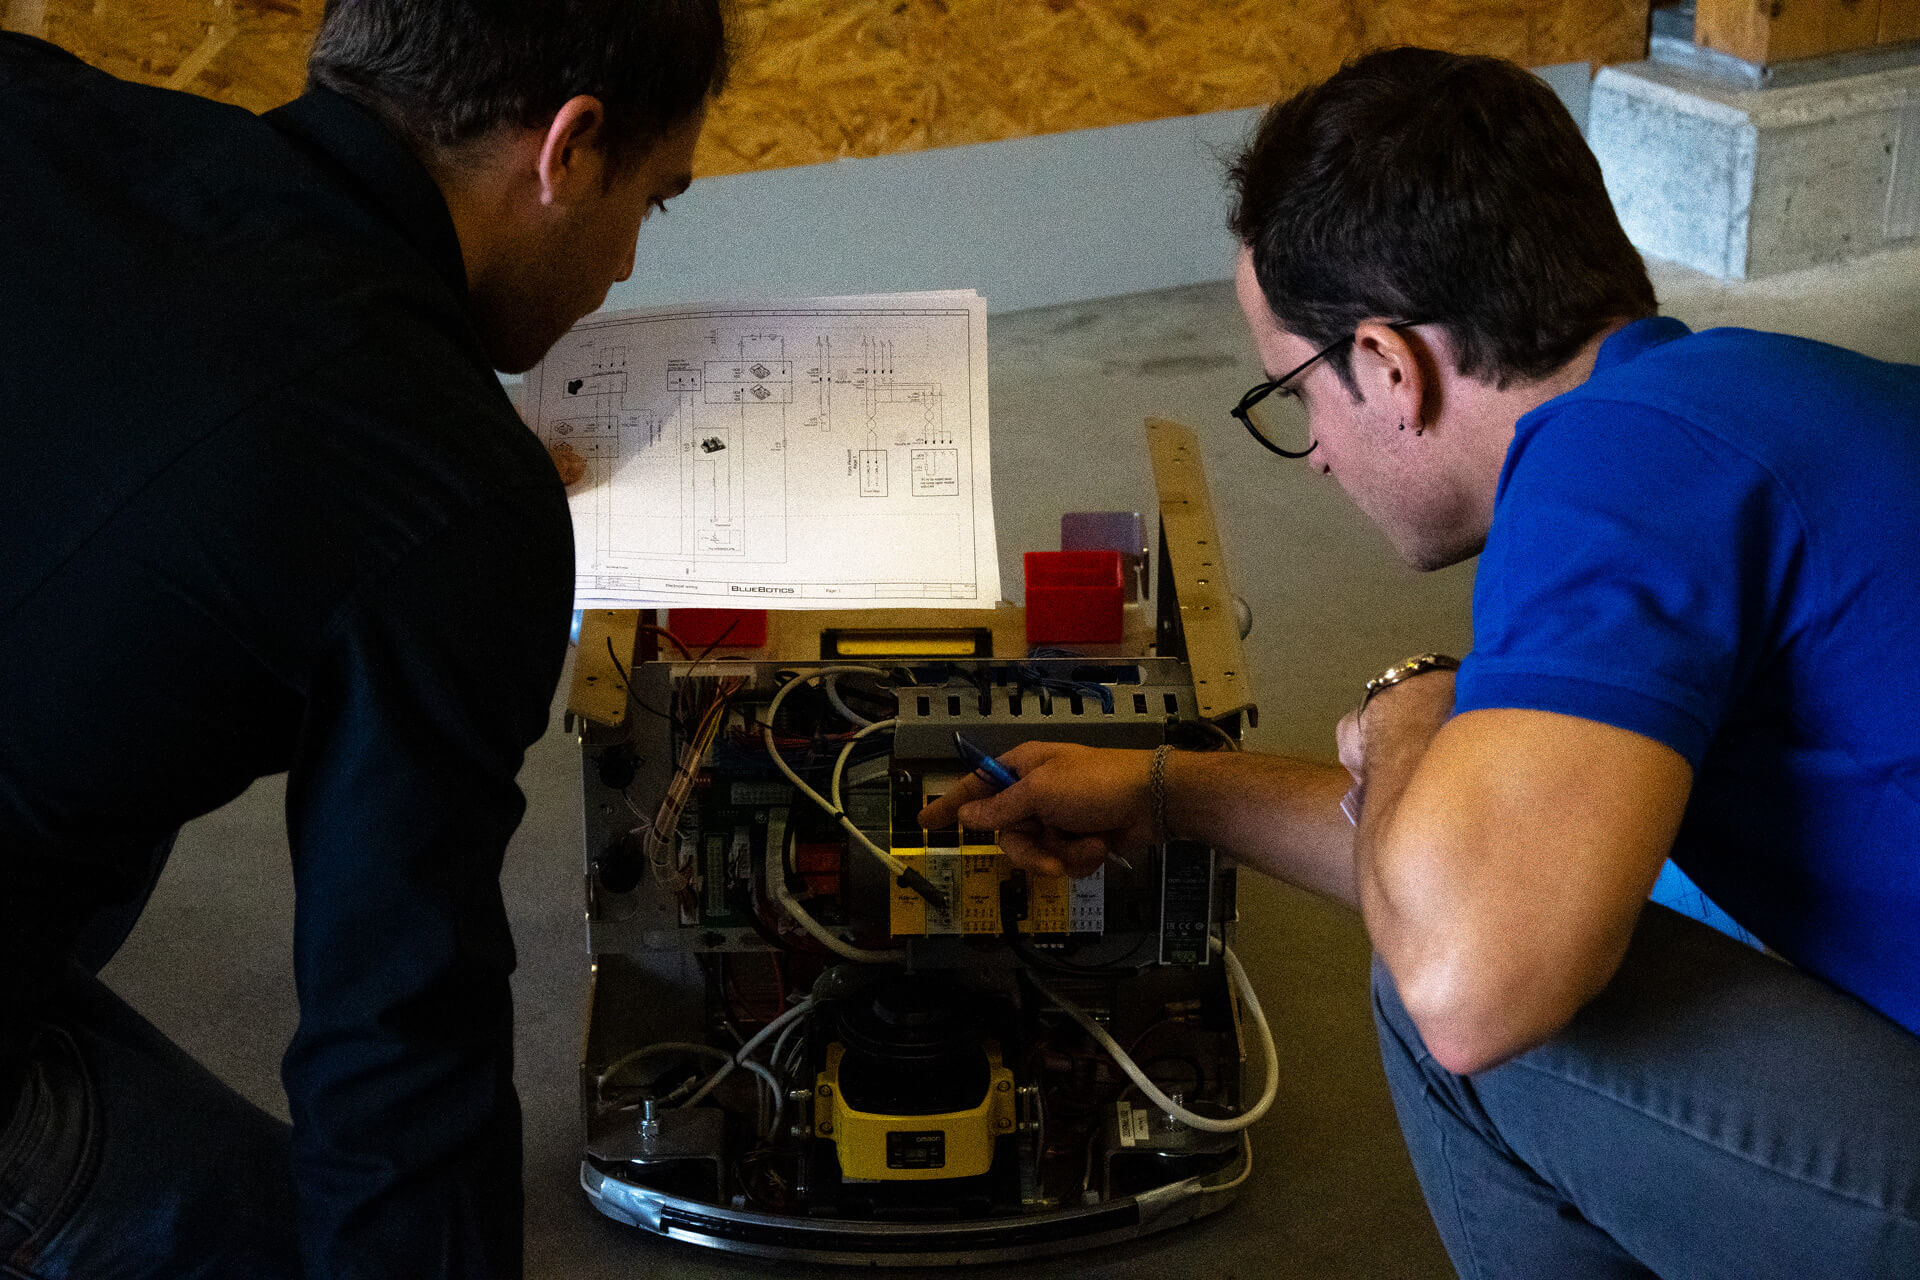
Why is this higher than the predicted 5% maintenance cost of a manual vehicle? It is not because automated vehicles break down more often. In fact, the opposite is true: because automated vehicles always run in predictable ways, they are less prone to wear and tear than their manual cousins. But, when maintenance is needed, it can be more expensive, as AGVs are more complex than purely mechanical machines.
However, the biggest difference in maintenance costs is usually due to the cost of your integrator/vehicle supplier modifying your AGVs’ routes and actions as your operation evolves. This configuration work might be carried out piecemeal, on-demand, or form part of an annual maintenance plan.
Gather the following information:
- Cost of each AGV
- Annual maintenance cost (%)
5. How complex is your installation?
The complexity of your proposed AGV installation will directly influence how long it takes your integrator to install the vehicles, especially the portion during which your integrator will program and test different vehicles’ routes and actions.
Therefore, it pays to estimate how complex your installation will be, by calculating the number of pick and drop positions likely to be required. Here is how we define the different levels of complexity in our AGV ROI Calculator tool:
- Low: up to 10 pick/drop positions
- Medium: 10-50 pick/drop positions
- High: 50+ pick/drop positions
We recommend taking some time on-site to record exactly how many pick and drop positions are being used today. Speak to drivers about their typical workflows – shadow them for a day, maybe even review any security camera footage to count how many times a manual vehicle stops in a typical shift. Don’t forget to also work through how these processes should look when automated. Try to standardize and simplify them, as many manual processes are difficult to automate ‘as is.’
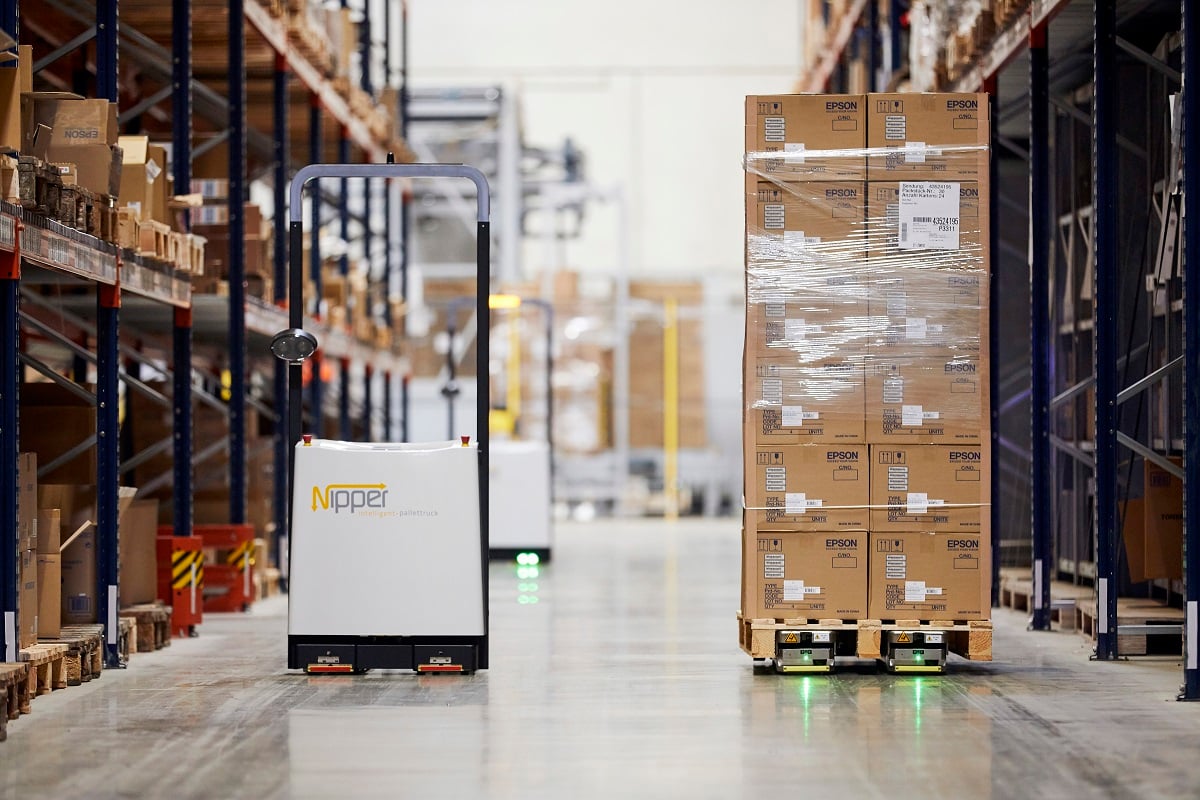
With these figures in hand, you can estimate the cost of installing your new vehicles and setting up your desired AGV operation - based on the number of AGVs you will deploy and the complexity of the installation. Your integrator may charge you a one-off fee for this job – which is mainly software-based - or it might be rolled into their wider vehicle quotation. Ask about this.
- For example, if you have a low complexity operation (5-10 vehicles and up to 10 pick/drop positions), the installation cost might be between USD $18,000 and $23,000.
- For a medium complexity installation (the same number of vehicles, but between 10 and 50 pick/drop positions), the estimated installation cost might be between USD $30,000 and $37,000.
- Whereas with a high complexity operation (5-10 vehicles and more than 50 pick/drop positions), the estimated installation cost might be between USD $51,000 and $67,000.
While knowing the number of pick and drop points will help you arrive at a rough estimate, you also need to take into account other factors, such as:
- If you are installing more than one type of AGV, this could add to the complexity of the operation.
- Take into account the knowledge of your staff. Will you need to bring in outside experts, or invest in extra training?
- The size and density of your installation. Larger installations are generally more complex, but small, densely packed spaces can also be challenging to set up.
- Will you need to interface your AGVs with equipment such as automatic doors, palletizers, elevators or other machines?
- How close are you to your integrator, or a major airport or transport hub? Bringing in new vehicles or experts to help with the installation does have a cost.
If estimating your exact installation cost is proving tricky: book a call with our expert team for a more complete calculation, or take the examples above.
After completing this section, you should have an idea of:
- Your installation’s complexity
- An estimated installation cost
How to calculate ROI for AGVs
In this section, we walk you through the calculations needed to calculate AGV ROI. These are the same steps used by our AGV ROI Calculator tool.
1. Manual vehicle costs
To find the true price of your company's existing manual vehicles, calculate the following:
- Total vehicle cost
Multiply the number of vehicles x vehicle cost to find the cost of your vehicles at the start of year one.
To the total vehicle cost, add the:
- Annual maintenance cost
Take the number of vehicles x cost per vehicle x annual maintenance cost (estimated at 5%). This gives the total annual maintenance costs of your vehicles for years two to five (and beyond).
| Manual vehicle costs (year 1) | |
|---|---|
| Number of vehicles | |
| x Cost per vehicle | |
| = Total vehicle cost | |
| Total vehicle cost | |
| x Annual maintenance cost | |
| = Total annual maintenance cost (%) | |
After year one, take only the total annual maintenance cost.
| Manual vehicle costs (years 2-5) | |
|---|---|
| Number of vehicles | |
| x Cost per vehicle | |
| = Total vehicle cost | |
| Total vehicle cost | |
| x Annual maintenance cost | |
| = Total annual maintenance cost (%) | |
2. Staffing costs associated with manual vehicles
The following calculations take into account the true cost of operating your manual vehicles. All of these numbers can be applied to every year of your forecast.
- Total driver salaries
Multiply the number of drivers x average annual driver salary - Annual driver overheads
Multiply the number of drivers x average annual driver salary x annual driver overhead (% of salary) - Annual goods damage costs
Multiply the number of vehicles x estimated damage caused per vehicle
| Labor costs associated with manual vehicles | |
|---|---|
| Number of drivers | |
| x Annual driver salary | |
| = Total annual drivers’ salary | |
| Total annual drivers’ salary | |
| x Annual driver overheads (% of salary) | |
| = Total annual driver overheads | |
| Number of vehicles | |
| x Estimated damage caused per vehicle | |
| = Annual goods damage cost | |
3. AGV costs
To make the comparison with manual vehicles, we’ll calculate the likely total cost of your automated fleet.
- Number of vehicles required
As discussed above, on average we can assume 1.4 automated vehicles to replace a manual vehicle. - Total vehicle cost
Multiply the number of AGVs x AGV cost to find the cost of your vehicles at the start of year one. - Annual maintenance cost
Multiply the number of vehicles x cost per AGV x annual maintenance cost (est. 10%). This gives the total annual maintenance costs of your AGVs for years two to five (and beyond). - Installation cost (estimate)
As noted above, installation costs will vary depending on the complexity of your operation.
| AGV costs | |
|---|---|
| Number of AGVs needed to replace 1 manual vehicle | |
| x Number of current manual vehicles | |
| = Number of AGVs required | |
| Number of AGVs required | |
| x Cost per AGV | |
| = Total vehicle cost | |
| Number of AGVs | |
| x Cost per AGV | |
| x Annual maintenance cost (%) | |
| = Annual maintenance cost | |
| Installation cost (estimate) | |
4. ROI calculation
To calculate the breakeven point of your AGVs, we will extend the calculation over five years.
| Year 1 | Year 2 | Year 3 | Year 4 | Year 5 | |
|---|---|---|---|---|---|
| Manual vehicle cost | Total manual vehicle cost | - | - | - | - |
| - | Total annual maintenance cost (%) | Total annual maintenance cost (%) | Total annual maintenance cost (%) | Total annual maintenance cost (%) | |
| Total annual drivers’ salary | Total annual drivers’ salary | Total annual drivers’ salary | Total annual drivers’ salary | Total annual drivers’ salary | |
| Annual goods damage cost | Annual goods damage cost | Annual goods damage cost | Annual goods damage cost | Annual goods damage cost | |
| Total | Total year 1 | Total year 2 | Total year 3 | Total year 4 | Total year 5 |
| Cumulative total | Total year 1 | Total years 1 + 2 | Total years 1 + 2 + 3 | Total years 1 + 2 + 3 + 4 | Total years 1 + 2 + 3 + 4 +5 |
| AGV cost | Total AGV cost | - | - | - | - |
| - | Annual maintenance cost | Annual maintenance cost | Annual maintenance cost | Annual maintenance cost | |
| Installation cost | Total installation cost | - | - | - | - |
| Total | Total year 1 | Total year 2 | Total year 3 | Total year 4 | Total year 5 |
| Cumulative total | Total year 1 | Total years 1 + 2 | Total years 1 + 2 + 3 | Total years 1 + 2 + 3 + 4 | Total years 1 + 2 + 3 + 4 + 5 |
Even without entering your own numbers in the table above, it is clear that AGVs have a high upfront cost, and a low maintenance cost. Remember, AGVs effectively bundle labor and vehicle costs together, while eliminating goods damage. By contrast, manual vehicles and staff have a lower upfront cost, but higher costs year-on-year.
AGV ROI example: Manufacturing Plant Inc.
Let’s take a look at how these calculations might play out in real life with the help of a fictitious use case.
Alex is the automation manager at a small manufacturing plant. Alex's employer, Manufacturing Plant Inc., is keen to automate the site’s manual material handling processes since its team is finding it increasingly difficult to hire and retain drivers in today’s challenging labor market (and wages keep rising as a result).
Plus, it is clear the company’s competitors are already automating their operations.
The processes Alex is looking to automate are:
- Transporting parts from warehouse to assembly lines
- Transporting empty bins back to the warehouse
- Transporting finished goods to a different part of the warehouse
Let’s follow Alex and calculate the potential ROI of this mobile automation project.
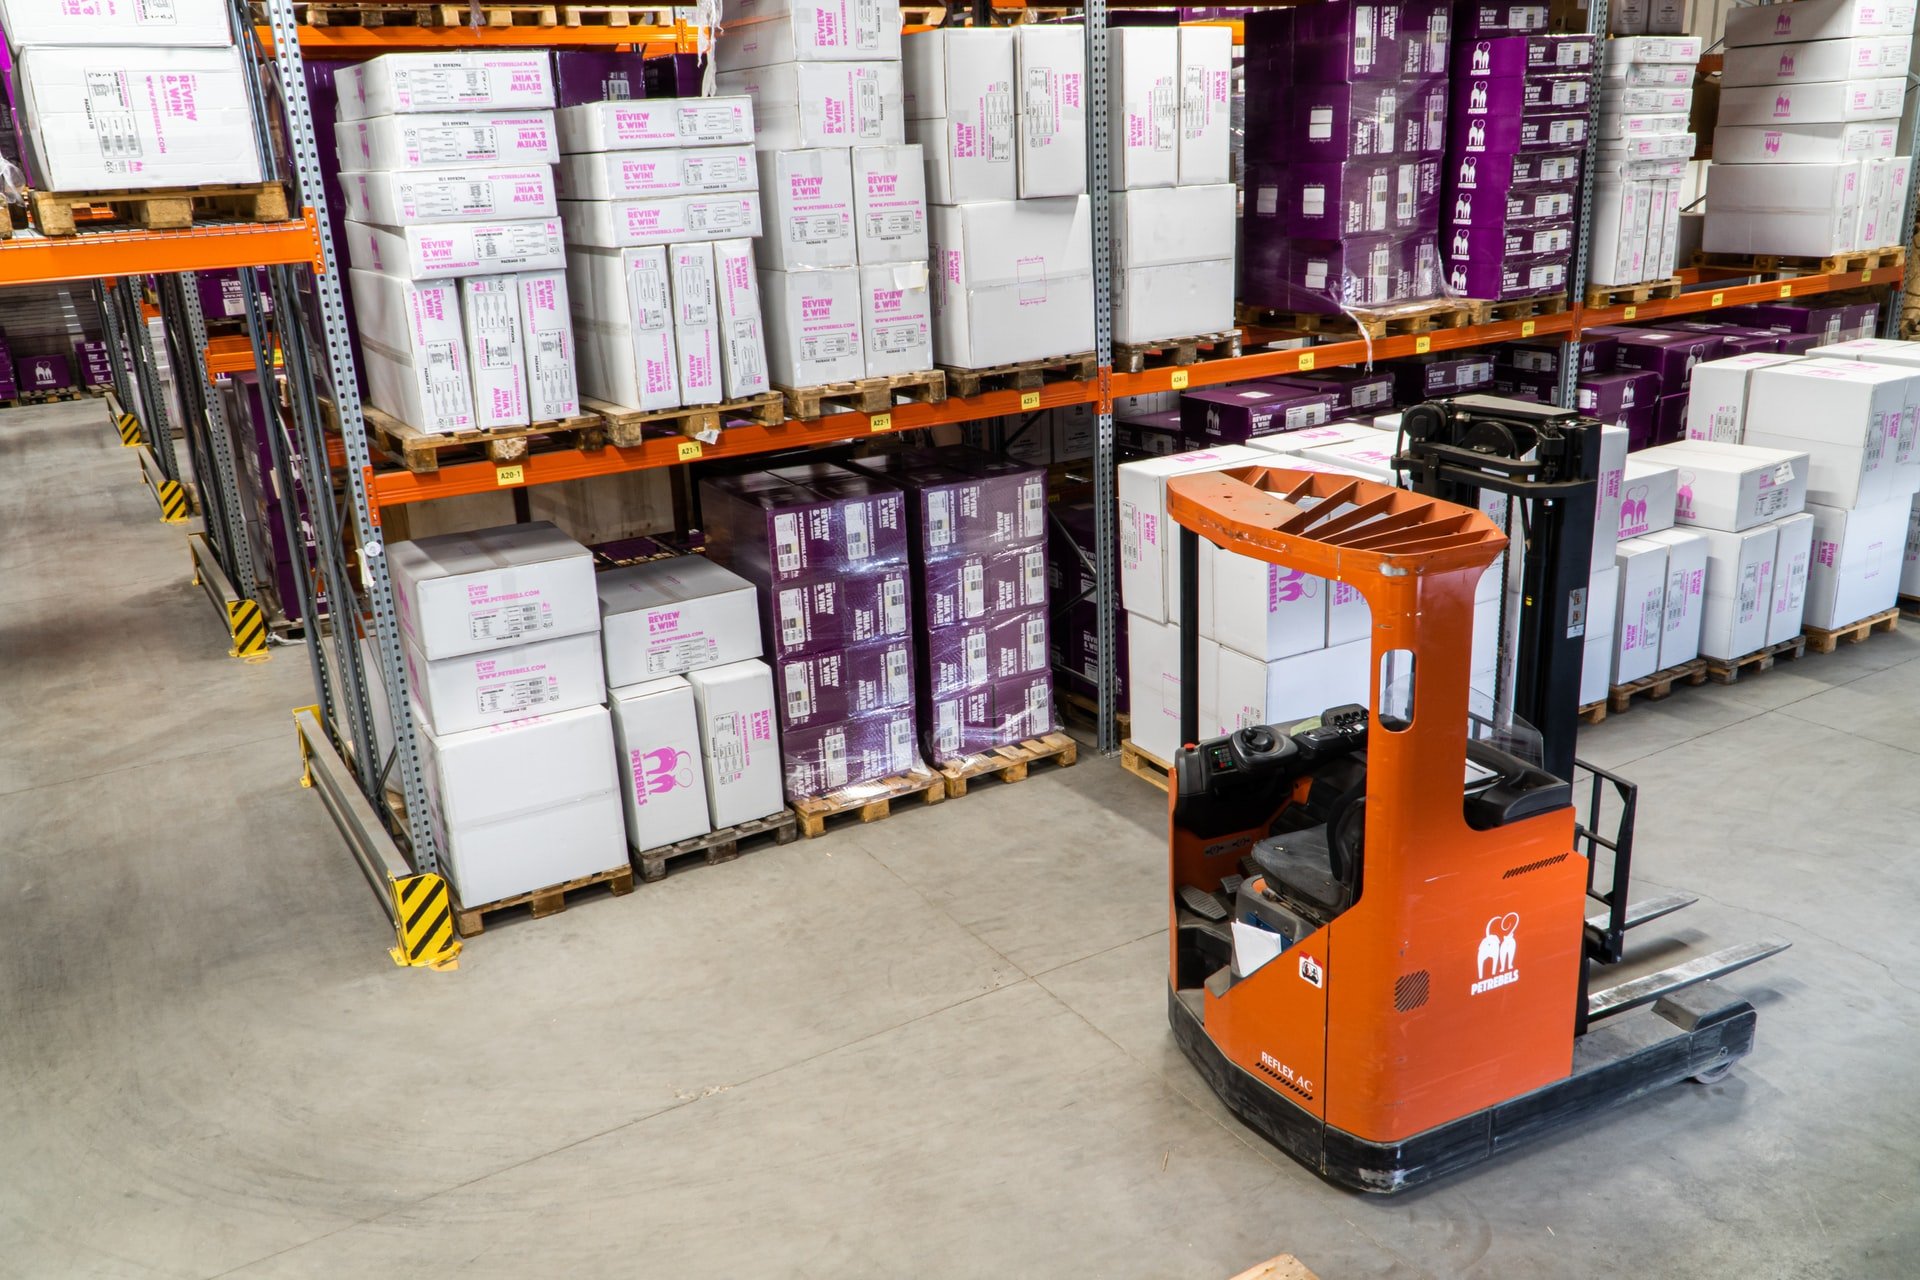
Manufacturing Plant Inc. currently runs two manual forklifts. Alex checks the price of the forklifts online and asks the team what maintenance has cost over the past three years – as predicted, it is approximately 5% of the vehicles’ purchase price.
| Manual vehicles | |
|---|---|
| Number of vehicles | 2 |
| x Cost per vehicle | $25,000 |
| Total annual maintenance cost (%) | $10,000 |
Manufacturing Plant Inc. runs two shifts per day, five days a week. Therefore, it employs four drivers to operate its two forklifts.
Each full-time driver’s salary is USD $40,000. Alex also learns that the company’s annual cost of damage to goods caused by the manual trucks is $10,000 – much higher than anyone at Manufacturing Plant Inc. would like.
| Labor costs | |
|---|---|
| Shifts per day | 2 |
| Days per working week | 5 |
| Drivers (2x vehicles) | 4 |
| Annual driver salary | $40,000 |
| Annual driver overheads (15% of each driver's salary) | $24,000 ($6,000 per driver) |
| Annual damaged goods cost | $10,000 |
Since Alex is looking to replace two manual forklifts, and the company is running two shifts per day, we can roughly calculate the company will need three automated guided vehicles.
| AGVs | |
|---|---|
| Number of AGVs to replace 1 manual vehicle | 1.5 |
| Number of AGVs | 3 |
After doing some initial AGV research using this site's Vehicle Finder, Alex identifies a preferred AGV model and runs the calculations based on this automated forklift costing $120,000.
| AGV cost | |
|---|---|
| Cost per vehicle | $120,000 |
| Annual maintenance cost (%) | 10% ($12,000 per vehicle) |
| $24,000 | |
Last month, Alex and the company's longest-serving forklift driver spent two days at Manufacturing Plant Inc’s warehouse, mapping out exactly how many pick and drop positions they would need to cover. For such a small operation, they were surprised to find this came to 300 positions:
- Transporting parts from warehouse to assembly line: 95 pick points and 5 drop points
- Transporting empty bins back to the warehouse: 10 pick points and 90 drop points
- Transporting finished goods to a different part of the warehouse: 10 pick points and 90 drop points
So many pick and drop positions mean the installation’s complexity is, in fact, relatively high.
The installation cost is an estimate which is automatically calculated by our AGV ROI Calculator.
| Installation complexity and cost | |
|---|---|
| Installation complexity | High |
| Installation cost | $65,143 (automatically calculated based on the number of vehicles and pick/drop points) |
AGV ROI example: 5-year projection
With all these calculations done, Alex can assess the final figures, projected over five years.
| Year 1 | Year 2 | Year 3 | Year 4 | Year 5 | |
|---|---|---|---|---|---|
| Manual vehicles hardware & maintenance | |||||
| Manual vehicle costs | $50,000 | - | - | - | - |
| Annual maintenance cost | - | $2,500 | $2,500 | $2,500 | $2,500 |
| Subtotal | $50,000 | $2,500 | $2,500 | $2,500 | $2,500 |
| Manual vehicles labor & damage | |||||
| Total driver salaries | $160,000 | $160,000 | $160,000 | $160,000 | $160,000 |
| Annual driver overheads | $24,000 | $24,000 | $24,000 | $24,000 | $24,000 |
| Annual goods damage cost | $10,000 | $10,000 | $10,000 | $10,000 | $10,000 |
| Subtotal | $194,000 | $194,000 | $194,000 | $194,000 | $194,000 |
| Total | $244,000 | $196,500 | $196,500 | $196,500 | $196,500 |
| Cumulative total | $244,000 | $440,500 | $667,000 | $833,500 | $1,030,000 |
| Automated forklifts | |||||
| AGV costs | $360,000 | - | - | - | - |
| Annual maintenance cost | - | $36,000 | $36,000 | $36,000 | $36,000 |
| Total | $65,143 | $36,000 | $36,000 | $36,000 | $36,000 |
| Cumulative total | $425,143 | $461,143 | $497,143 | $533,143 | $569,143 |
The results look good. If Alex’s figures are correct, Manufacturing Plant Inc.’s automation project should break even in a little over two years (or quicker if Alex decides to sell the manual vehicles, or the number of shifts run by the AGVs can be increased).
- In an average year, operating manual vehicles and their drivers cost Manufacturing Plant Inc. USD $196,500 (excluding the capital costs of the vehicles).
- An average year of automated vehicles doing the same work (again excluding the capital costs of the vehicles) will cost Manufacturing Plant Inc. just $36,000 – less than the current annual wage of one driver.
Alex has built a solid business case for automation – complete with solid figures – ready to take to management to get the project moving.

